Mozambique Exports
Located along Africa’s southeastern coast, the Republic of Mozambique shipped US$4.7 billion worth of goods around the globe in 2019. That dollar amount reflects a 47.8% increase since 2015 but a -8.5% decline from 2018 to 2019.
The Republic of Mozambique shipped US$4.7 billion worth of goods around the globe in 2019. That dollar amount reflects a 47.8% increase since 2015 but a -8.5% decline from 2018 to 2019.
Based on the average exchange rate for 2019, the Mozambican metical depreciated by -56.4% against the US dollar since 2015 and declined by -3.7% from 2018 to 2019. Mozambique’s weaker local currency makes its exports paid for in stronger US dollars relatively less expensive for international buyers.
The latest available country-specific data shows that about four-fifths (79.4%) of products exported from Mozambique were bought by importers in: South Africa (18.9% of the global total), India (17%), China (6.9%), Italy (6.4%), Netherlands (5.2%), United Kingdom (4.7%), Belgium (4.2%), Spain (3.6%), Singapore (also 3.6%), Hong Kong (3.4%), South Korea (2.9%) and Poland (2.7%).
From a continental perspective, 41.3% of Mozambique exports by value were delivered to Asian countries while 31.6% were sold to importers in Europe. Mozambique shipped another 23.7% worth of goods to fellow African nations. Smaller percentages went to North American (2.1%), Latin America (1.3%) excluding Mexico but including the Caribbean then Oceania (0.04%) led by Australia.
Given Mozambique’s population of 32.2 million people, its total $4.7 billion in 2019 exports translates to roughly $150 for every resident in the southeast African nation.
In 2017 Mozambique exported $6.58B, making it the 98th largest exporter in the world. During the last five years the exports of Mozambique have increased at an annualized rate of 1%, from $6.02B in 2012 to $6.58B in 2017. The most recent exports are led by Coke which represent 23% of the total exports of Mozambique, followed by Coal Briquettes, which account for 21.9%.
Source: OEC
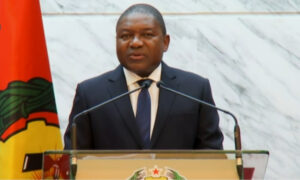
Mozambican President Filipe Nyusi


Mozambican Export Figures in a nutshell.
Given Mozambique’s population of 32.2 million people, its total $4.7 billion in 2019 exports translates to roughly $150 for every resident in the southeast African nation.
The top five exported HS 6 digit level products to world by Mozambique along with trade value are:
- Mozambique exported Bars, rods and profiles, aluminium, not alloyed , worth US$ 1,045,781.87 million.
- Mozambique exported Coke and semi-coke of coal, of lignite or of pe , worth US$ 957,504.64 million.
- Mozambique exported Other coal, not agglomerated, nes , worth US$ 639,144.39 million.
- Mozambique exported Electrical energy , worth US$ 401,075.17 million.
- Mozambique exported Rubies, sapphires and emeralds further worked t , worth US$ 197,609.07 million.
The top five countries to which Mozambique exported 2018 along with the partner share in percentage are:
- Mozambique exports to India worth US$ 1,436 million, with a partner share of 27.63 percent.
- Mozambique exports to Netherlands worth US$ 1,103 million, with a partner share of 21.23 percent.
- Mozambique exports to South Africa worth US$ 896 million, with a partner share of 17.24 percent.
- Mozambique exports to China worth US$ 302 million, with a partner share of 5.81 percent.
- Mozambique exports to Hong Kong, China worth US$ 124 million, with a partner share of 2.39 percent.
Mozambique World Development Indicators (WDI) 2018
Key Development Indicators of Mozambique in 2018 are below
- The population of Mozambique is 29,495,962.
- GDP in US$ is 14,717 million .
- GNI per capita, Atlas method in current US dollars is 460.00.
- Trade balance in US$ is -5,366.00 million.
- Trade in services as percentage of GDP is -36.46 %.
- The ease of doing business rank for Mozambique is 138.
- The trade across border rank is 94.
Doing Business and WDI
Export
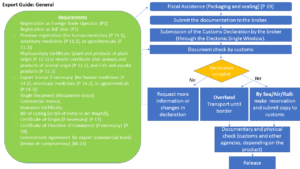
Export procedures can be complex and often product-specific. For information on the requirements for a specific product, the commodity search function can be used. Below is an overview of a standard export process, and a list of the more common export measures.
Below is an overview of a standard export process, and a list of the more common export measures. The codes in square brackets refer to specific processes and measures, listed below.
It is important to note that there are specific requirements for certain products, and what is presented below and in the links under the image are for the most common products.


